The Doji is one of the best-known Chartist figures. It’s also extremely simple. It is defined solely by a candle that marks strong indecision.
The buying and selling forces of this candle are almost in equilibrium, so it is represented by a very small candle body.
Doji block configuration
On BullTrading, you can configure each block to make it unique. In this block, you can define the time unit, the period used, …
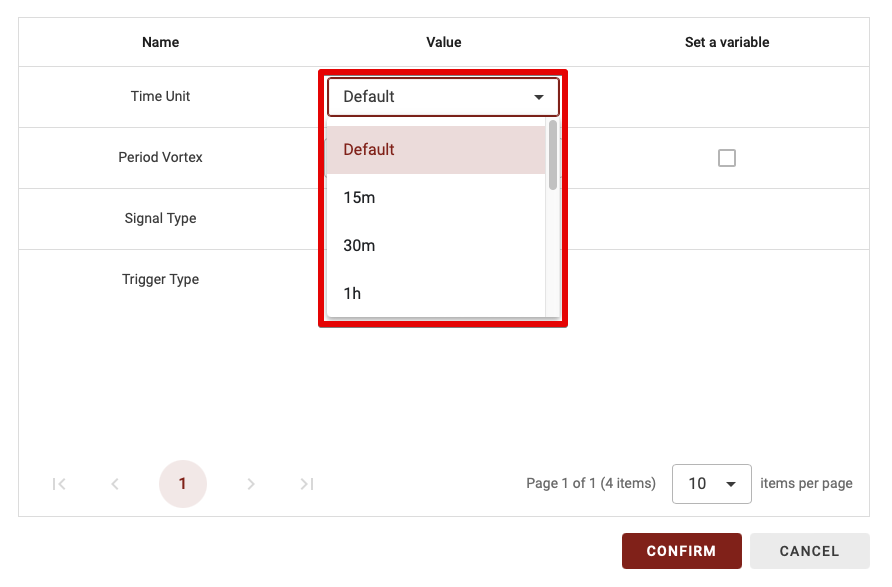
Time Unit
As Bulltrading has the ability to create a multi-timeframe strategy, you have the option of choosing which time period to calculate this indicator on. There are two possibilities:
Default: if you leave Default, the time unit will vary according to the time horizon you use in the backtest.
15m,30m,1d… : If you choose a specific time unit in the time unit, this means that you will choose this specific time unit whatever time unit you use to backtest your strategy. TIP: If you’re a beginner, I advise you to leave the default time unit.
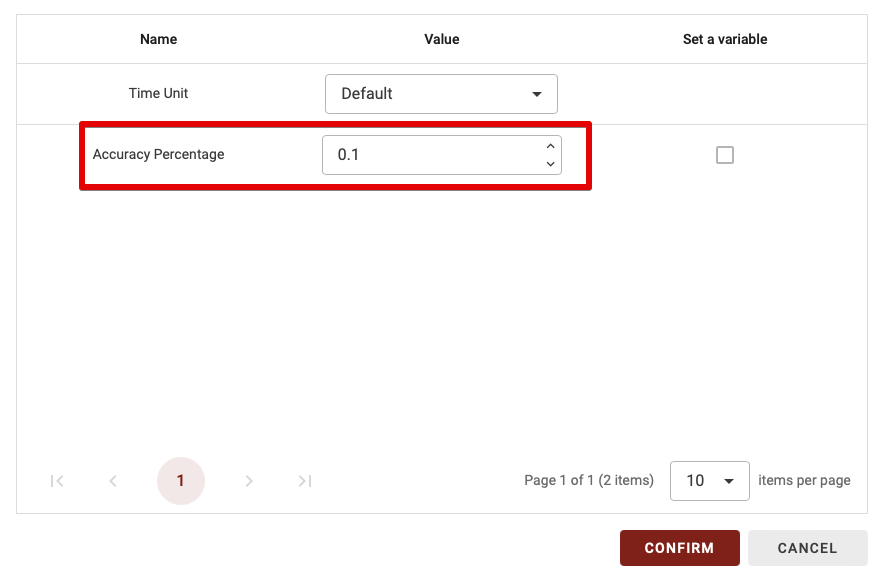
Accuracy Percentage
The “Accuracy Percentage” parameter defines the maximum percentage between the opening price and the closing price. For example, here a candle will be considered a Doji only when the variation in absolute value (regardless of sign) is less than 0.1%.
Understanding the RSI Sto crossover indicator The stochastic RSI indicator is extremely similar to the RSI indicator. It will also indicate overbought […]