The stochastic RSI indicator is extremely similar to the RSI indicator. It will also indicate overbought and oversold zones. However, instead of focusing on a single RSI value, it relates it to the minimum and maximum RSI for a given period.
Thus, we generally find thresholds similar to the RSI
A StochRSI above 0.8 (or 80) is generally considered overbought.
A StochRSI below 0.2 (or 20) is generally considered oversold.
Stochastic RSI block configuration
On BullTrading, you can configure each block to make it unique. In this block, you can define the time unit, the period used, …
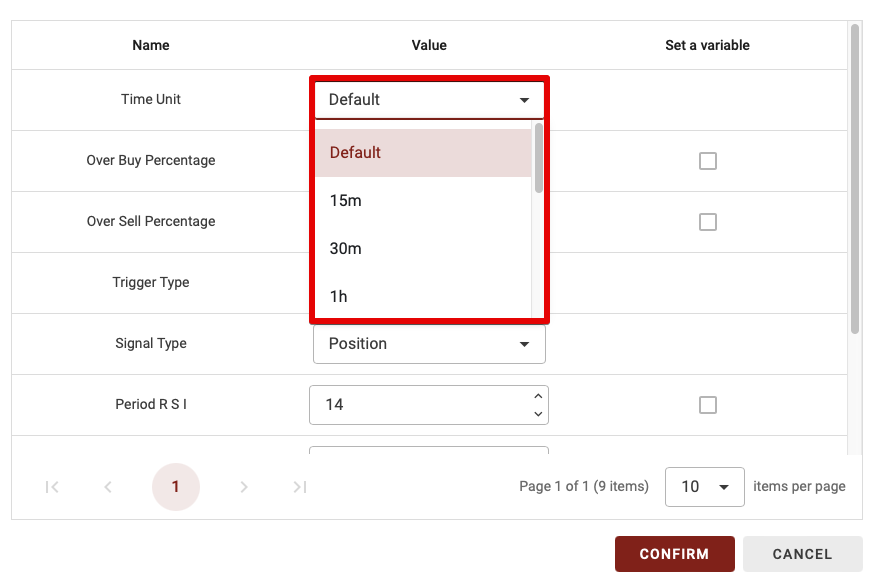
Time Unit
As Bulltrading has the ability to create a multi-timeframe strategy, you have the option of choosing which time period to calculate this indicator on. There are two possibilities:
Default: if you leave Default, the time unit will vary according to the time horizon you use in the backtest.
15m,30m,1d… : If you choose a specific time unit in the time unit, this means that you will choose this specific time unit whatever time unit you use to backtest your strategy.
TIP: If you’re a beginner, I advise you to leave the default time unit.
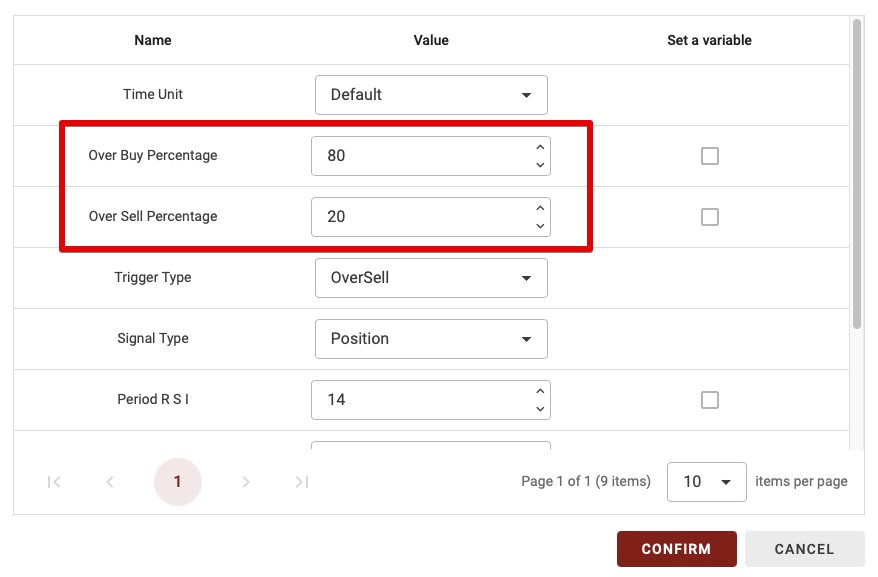
Over Buy & Over sell Percentages
As with the RSI, we need to define overbought and oversold thresholds for the RSI stochastic. These thresholds are used to determine whether or not you are in the oversold or overbought zones. By default, on the stochastic RSI, we take 20 for the oversold threshold and 80 for the overbought.
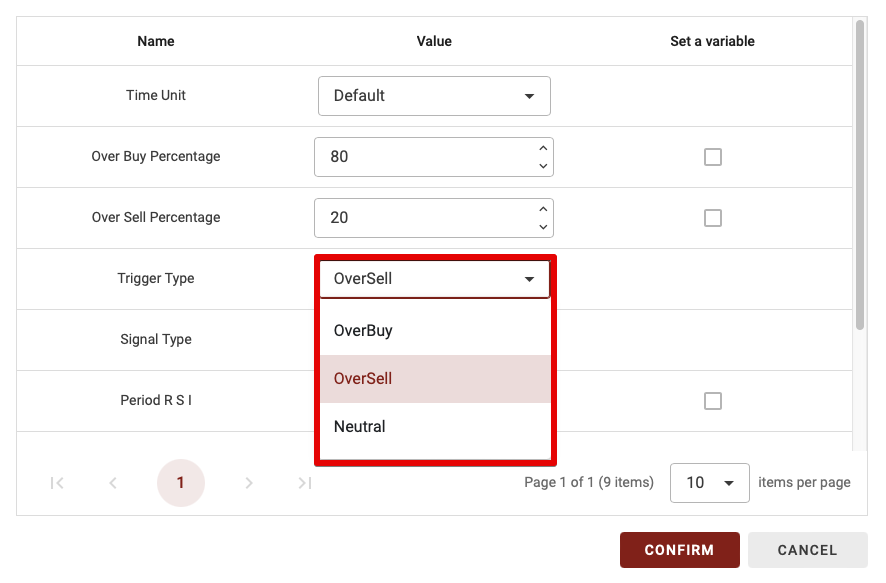
Trigger Type
This parameter has only three possibilities. Let’s explain the difference:
Overbuy: if you set the trigger type as overbuy, the block is validated if the stochastic RSI line is above the overbuy threshold.
Oversell: if you define the trigger type as oversell, the block is validated if the stochastic RSI line is below the oversold threshold.
Neutral: if you set the trigger type to neutral, the block is validated if the stochastic RSI line is between the overbought and oversold thresholds.
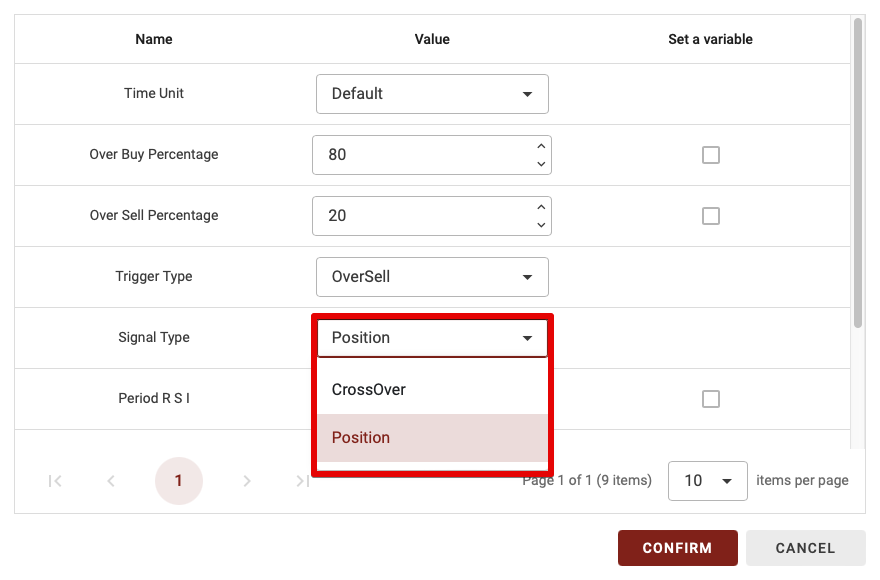
Signal Type
This parameter has only two possibilities: CrossOver and Position. Let’s explain the difference this parameter makes:
CrossOver: if you choose CrossOver for the signal type, this block will be validated only when you enter the desired zone (oversell, neutral or overbuy).
Position: with this option, the block will be validated as long as you are in the chosen trigger type (oversell, neutral or overbuy).
TIPS: the CrossOver parameter is much more restrictive, so it’s worth using it when you only have one or two indicators combined. However, if you have too many blocks combined with the Crossover parameter, this will greatly reduce the number of trades in your strategy, as we need, for example, a crossover between the two MAs + a crossover between the RSI 70 threshold + a crossover in the Vortex indicator…
So, when combining several indicator blocks, don’t set more than 1 or 2 blocks with the CrossOvers parameter if you’re a beginner.
Period RSI & Period Stoch
As with most indicators, we need a period over which to calculate our indicators. The default here is 14 of the time unit chosen for both the RSI and the stochastic RSI (which uses the RSI in its calculation).
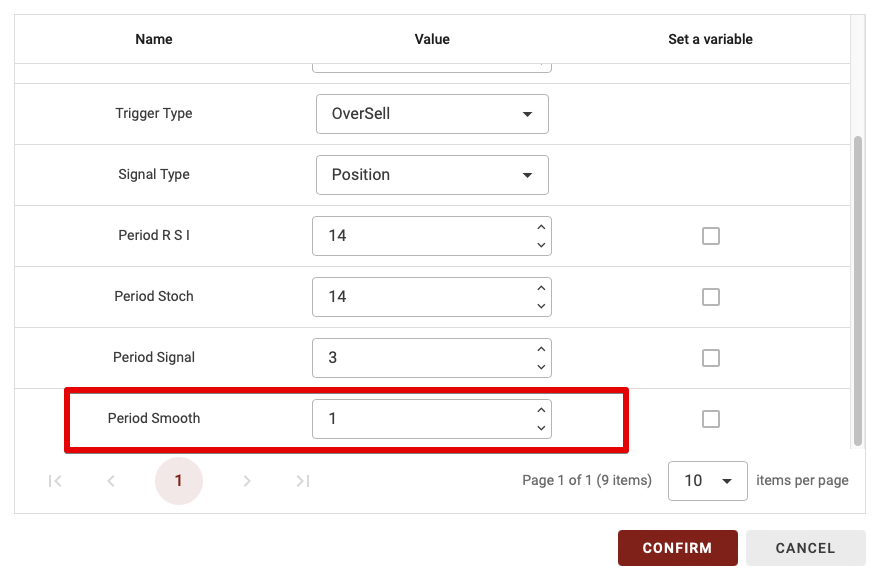
Period Smooth
After calculating the stochastic RSI curve, you can choose to smooth it: in other words, to apply a moving average to the curve. Here, by default, the value is 1, so a moving average over 1 period is applied, which means no smoothing. However, if you increase the value, you’ll make the stochastic RSI curve smoother.
Understanding the RSI Sto crossover indicator The stochastic RSI indicator is extremely similar to the RSI indicator. It will also indicate overbought […]